The 3 best Google Analytics reports to analyse your website traffic: 2. Channels
In our first article on the 3 best Google Analytics reports, we looked at how the Acquisition Overview report can provide insights into your website’s traffic. In this second article, we will focus on the Google Analytics Channels report and take an in-depth view of this traffic on your webpages.
Google Analytics Channels Report
The Channels report is a sub report of the Acquisition Overview. Through the Acquisition Overview, you can click into a particular channel, say Organic Search, and see exactly what webpages that traffic corresponds to.


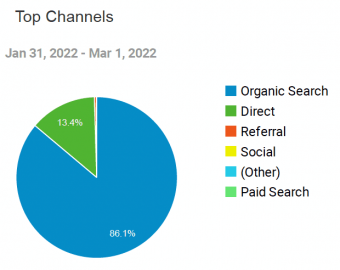
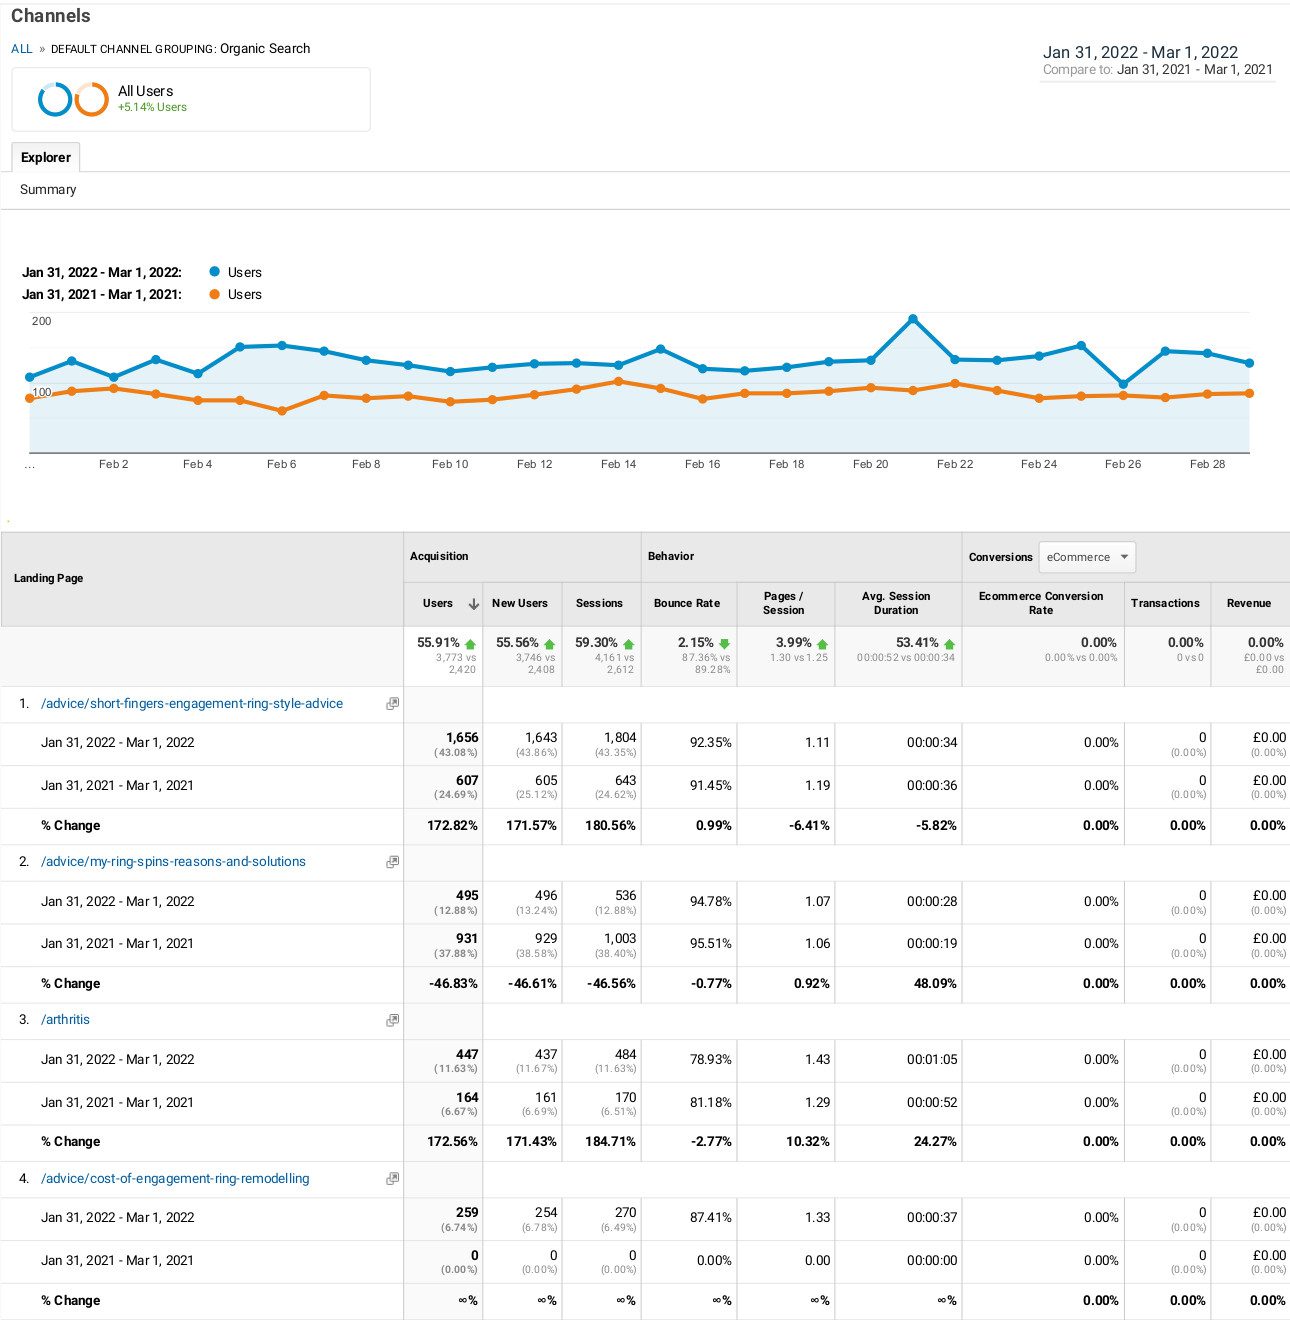
Here, we can see that, in February, the biggest driver of traffic to Company X’s website was through organic searches. If we then go into this channel, we can see exactly which landing pages users are visiting and how this compares to the previous year. This will give Company X a much clearer idea of how their organic search traffic is working.
Analysing you landing pages

Acquisition column
Taking the first four landing pages, we can see that number 1 and 3 have greatly increased their user traffic from the previous year. This has followed efforts by Company X to improve SEO on these landing pages. They made sure that the key words used on the page exactly corresponded to what their clients were searching for and that the content on the pages is engaging.
Over the year, Company X also found that they had a number of direct enquiries from clients looking for engagement ring remodelling. This led them to create a special landing page for this need, which has since enticed more people onto their site.
The second landing page has lost hits. However, this was created as part of a digital advertising campaign the previous year, which explains the drop in traffic, although this still remains at a good level of visits.
Behavior column
The behaviour column reveals how a user behaved once they reached the landing page. This includes the bounce rate (how quickly they left the site without moving to another page), the Pages/Session (the number of pages a user visited on the site in one session), and the duration the user spent on the site in that session.
For Company X’s site, we can see there have been improvement is all areas with the bounce rate dropping and the pages/session and duration increasing.
Conversion column
You can set the drop down on the conversion column to a particular goal or to ‘All Goals’, but this section is mainly used to review the eCommerce function. Company X use their website as an overview of their business and services, rather than for sales. Their sales come by commissions, so there is no eCommerce function on their site. As such, this section remains blank on their report. For an eCommerce business, you will be able to see how a landing page directly led to a sale, as well as the best webpages for revenue streams.
How the Google Analytics Channels report can inform your buyer personas and digital marketing
The Channels report will help to identify the key entry pages for your website. This can help a number of your marketing activities including:
- Informing you if your buyer personas and the needs you are targeting correspond to the users visiting your site
- Identifying which webpages need improved SEO and more engaging content
- Revealing gaps on your site where targeted landing pages are needed
- Showing new personas you could target
- Establishing the best landing pages to use in a digital marketing campaign
What’s missing?
While the Channels report will give you an extended view of the Acquisition Overview so you can make informed decisions based on data, this doesn’t tell the whole story. What’s missing is the user journey beyond the entry point onto your website. In the final blog in this series, we will look at the Behaviour Flow report on Google Analytics to see how this data can complete the circle of traffic on your website and identify any targeted improvements you need to make.

